Linking issues is a great way to keep things in order, until there are too many of them. Then things that should be seen and understood at a glance end up taking longer than they should.
One day whilst working an issue with a particularly large number of linked issues and tasks. I got frustrated and decided to build a visual tool that would allow me to take in what was happening quickly.
Here is the result: a Chrome extension that will add an issue link visualisation on the right hand pane when in Atlassian Jira.
UPDATE (28/07/2017): Jira Issue Link Visualiser is now available in the Chrome store here
How to install
PS. If below version 7.0 of JIRA, you need to check if the REST API is enabled to work!
From the Chrome store JIRA Issue Link Visualiser
From Github
- Clone this repository to a directory on your computer
- In Chrome go to Settings>Extensions and enable “Developer Mode”
- Click “Load unpacked extension…” and open the directory where you cloned this repository
How to use/read this plugin
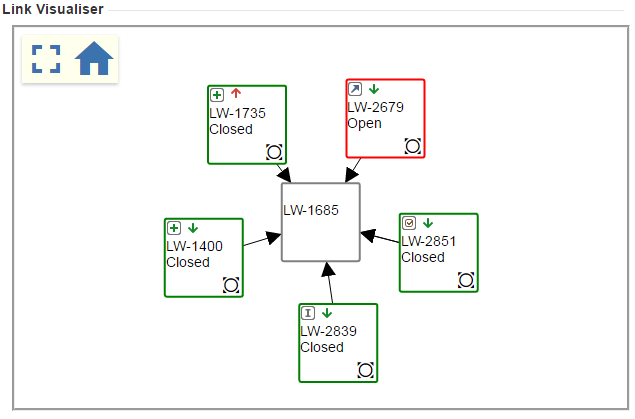
With the extension enabled you should now see a new module on the sidebar titled “Link Visualiser”
The gray box in the center of the screen is the current issue. It only has the issue ID as you can get more information from the issue screen you are on.
From the central issue it branches off to other issues with arrow lines describing the connection. The connections are as follows:
Links
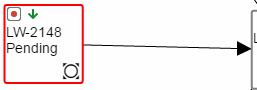
This link shows the arrow pointing to the issue on the right from the left. This indicates that the issue on the left is blocking the issue on the right or is inwardly related to the issue on the right.
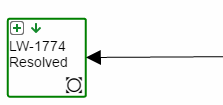
This link points to the issue on the left indicating that the issue on the right is blocking it or is outwardly related to it.
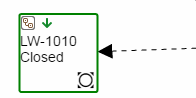
The dotted line will indicate a subtask and will always point away from the parent issue.
Issue boxes
Now lets see what the details in the issue boxes mean:
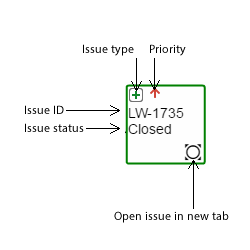
You would have also seen that the issue box outline can be either red, orange or green, what they are depends on their status:
- Green - Status is Resolved or Closed
- Orange - In Progress
- Red - Everything else (Open, Pending etc…)
The toolbar
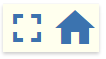
The toolbar has two buttons
 - Make the graph fullscreen or return from it
 - Centralise the graph to the current view window
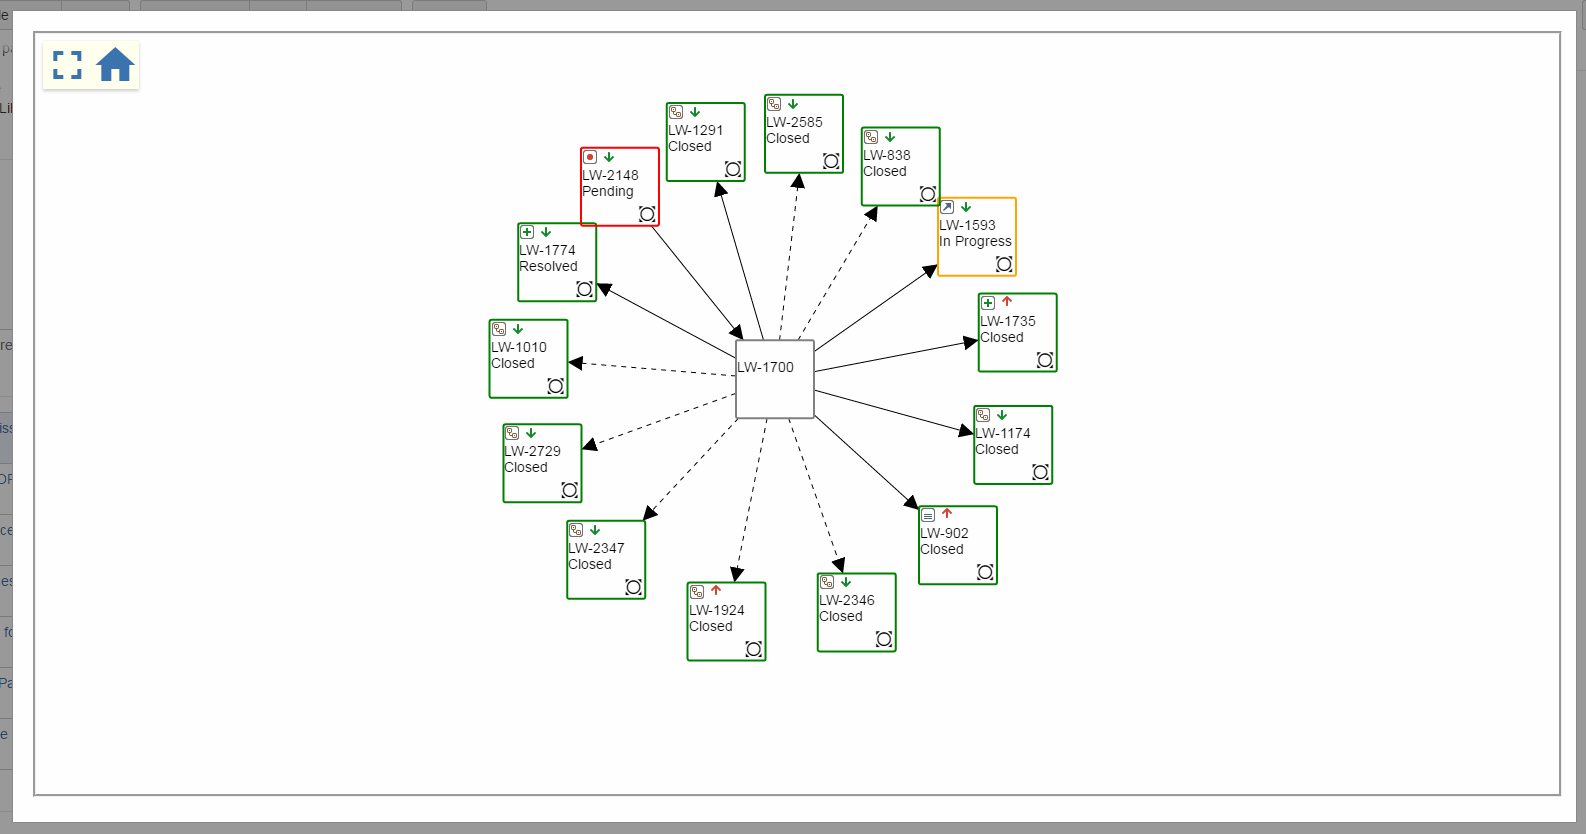
Fullscreen
The most handy function when handling large projects and issues with large amounts of links is the fullscreen mode. Here you can use the whole screen instead of the little view finder to get a handle on things.
Here is the link to repository on Github again and the Chrome store, let me know if there are any bugs or feature requests you have and have fun!